
January 2017 Update summary:
- Express Widget Library
- Product Boosting Rules
- Onboarding callouts
- Product Insights
- Minor updates and bugfixes
Express Search Preview
– Available to Searchspring Express customers only
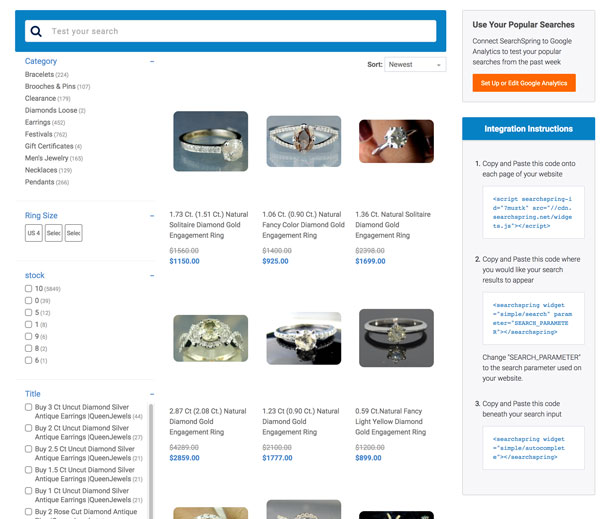
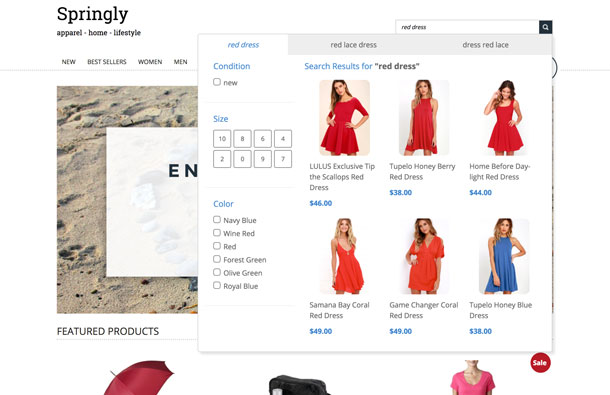
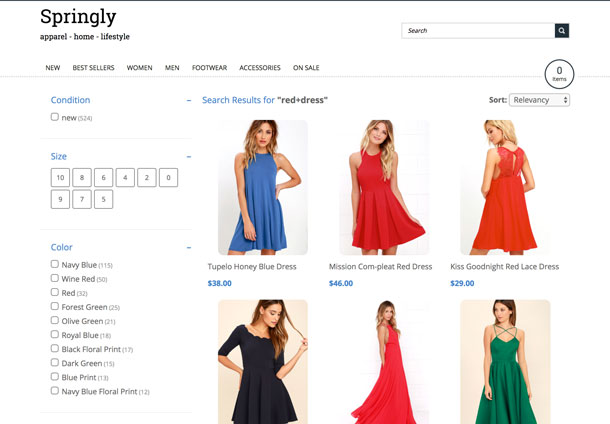
The Express Widget Library makes integrating Searchspring onto our Express customers’ stores smoother than ever. Once signing up and connecting their data feed, a customer can view the Relevancy Search Preview page in the SMC (Searchspring Management Console) to preview their search. This search preview has fully functional AutoComplete and Inline Search Results. It also includes a helpful “Popular Searches” panel that gives suggestions based on what actual customers are looking for.
On the same page, the customer can find easy integration instructions, which just a couple lines of widget code needed to put on their site. Once the code is copied, we’re live! The entire flow of getting Searchspring on a site in a beautiful way has been made dramatically more pain-free.
Product Boosting Rules
– Every customer with Visual Merchandising will see the new right-hand sidebar. Same content, different layout.
– Beta testing customers will see the Product Boosting Rules in this sidebar on Category campaigns only.
Searchspring now enables merchandisers to configure global and page-specific “product sorting rules” that directly control the order of items on category pages using a new, easy to use interface.
The new Product Sorting Rules enables merchandisers to control the ordering of items across a retail site. This interface makes it easy to deploy powerful hierarchical sorting rules that layer sorts in a tie-breaking fashion. Quick Actions make it easy to deploy common merchandising rules with guided configuration to make setup a breeze.
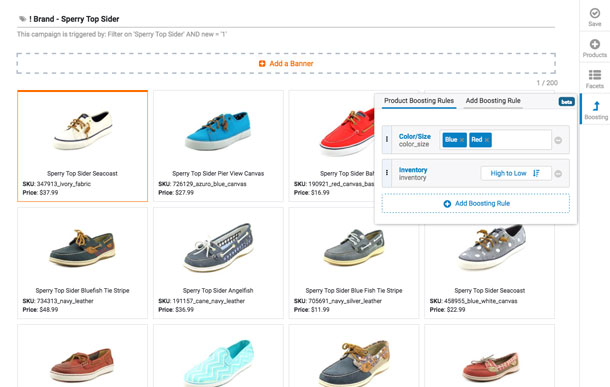
Boosting Rules change the way retailers manage products on their site. Instead of telling your ecommerce software where to put items individually, merchandisers create rules based on product attributes and the system dynamically orders products. This approach is simpler, more intuitive and reduces mistakes. It also has the important benefit of being real-time – as soon as new products are launched and assigned to the category, they will appear in the right place according to the sorting rules.
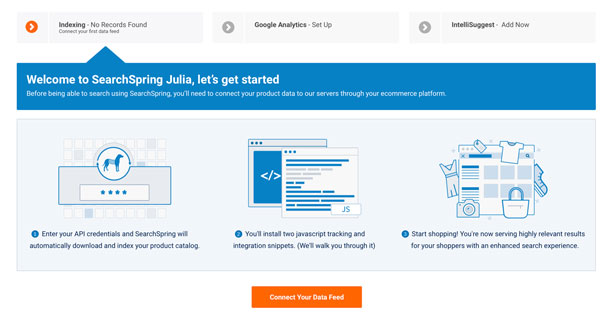
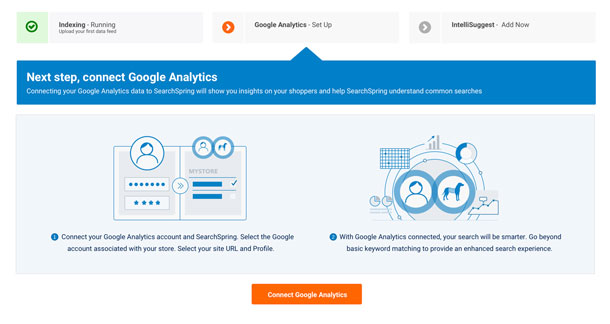
Onboarding Callouts
– Available to all customers
New customers will now be more easily guided along the setup process with their Searchspring account through our new Onboarding Callouts. The callouts accompany the Health Status Widgets on the Dashboard, and help to highlight which step the customer needs to take next, and its associated benefits. Once the data feed is connected and indexed, the customer returns to the dashboard to find instructions on the next step: Google Analytics.
January 2017 Product Insights
– Premium feature
– Get in touch with Customer Success to learn more
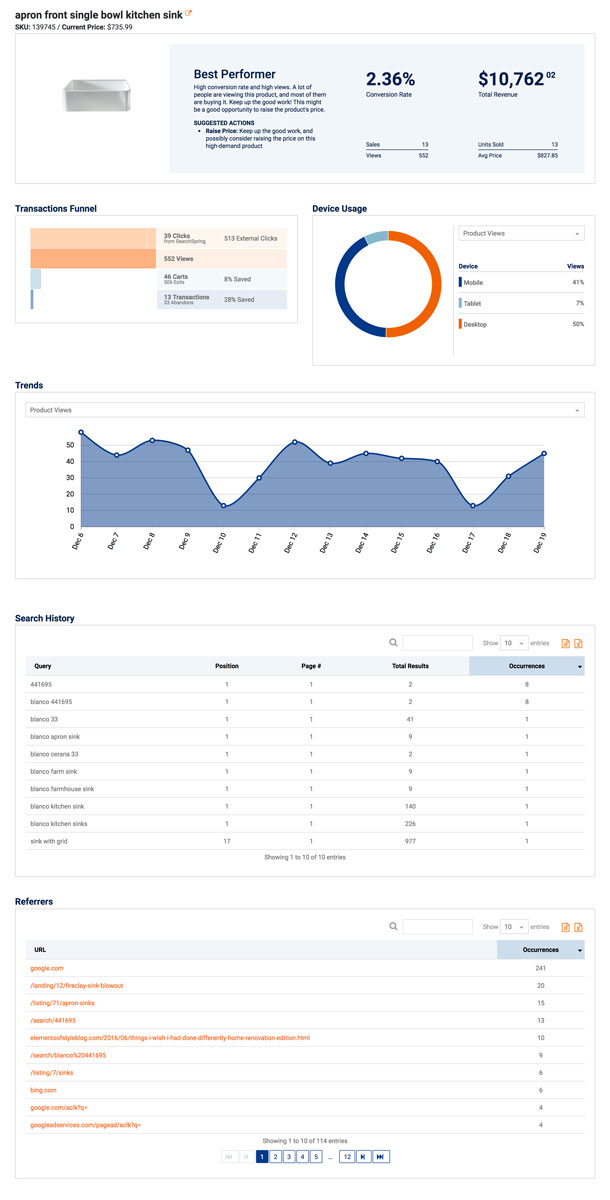
Product Insights, one of our most anticipated features, is now available to many of our customers. Product Insights brings to light both high level and granular level views of individual product performance.
At the top of the overview page, there are highlights showing the top Viewed, Grossing, and number of Transactions product for the selected timeframe. Below the highlights are the Performance Quadrants, which is a breakdown unique to Searchspring that shows groups of products that are Underexposed (high conversion, but low views), Overexposed (high view counts, low conversion), and Best Performers (high views and conversion), with suggested action steps for each group. Is a product overexposed? Try checking for product page issues, or lower the price. Beyond the quadrants you’ll find the Breakdown table, which has highly detailed information about every touched product. From views to carts to revenue, there are many ways to breakdown, sort, filter, and analyze this raw information.
The Product Detail page shows an even more advanced breakdown of an individual product’s performance. The highlights show which quadrant it lands in with its associated actions, the total revenue and conversion rate. Next you’ll find the Transaction Funnel, which visualizes the rate at which shoppers view (and from where they clicked), add to cart, and purchase this product. Device Usage highlights how many people interacted with this product by your choice of interaction type (view, cart, etc). The Trends graph shows your chosen metric over the selected timeframe. At the bottom of this page you’ll find the Search History, which shows all of the queries that shoppers used to get to this product. In addition, there is a Referrers table, which shows where all shoppers came from, and how often – be it Facebook, Google results, or Searchspring.
Enjoy our January 2017 product updates!