We are beginning to roll out some new insights within the Visual Merchandising list page! These new columns show you how often your campaign impacted your shoppers’ experience within the past 30 days, both in a trend graph and in total views.
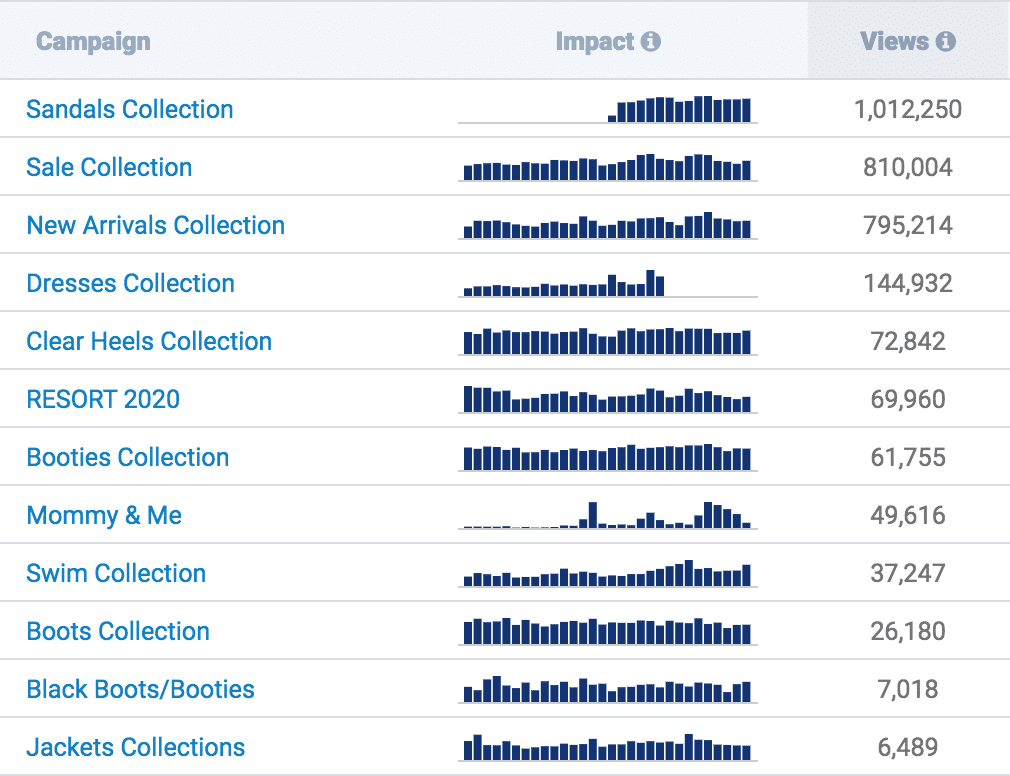
Trending graphs show you how your campaign has been affecting your store over time.
This is rolling out to stores who have our newest tracking installed. If you don’t see this yet, keep an eye out in the coming months as we migrate everyone over.
Want to keep tabs on us?
Sign up to get a variety of resources filled with ecommerce best practices straight to your inbox.
Related Blogs
Adam Witt
Related Resources
The latest guides, advice, and insights from the experts
We’ve been cooking up a lot of new tools for you to add to your utility belt. From new ways to segment your merchandising strategies, to breaking speed barriers and deeper data support. Hey, we weren’t kidding when we said that we give you superpowers, and we don’t plan on stopping anytime soon!
Compare two different date ranges against each other to get a better idea of changes in patterns over time. These date comparisons are now available on the Zero Results and Searches basic reports.
This comprehensive report helps you to understand what the most common spelling errors are; both in general and in different groups such as device type and over time.