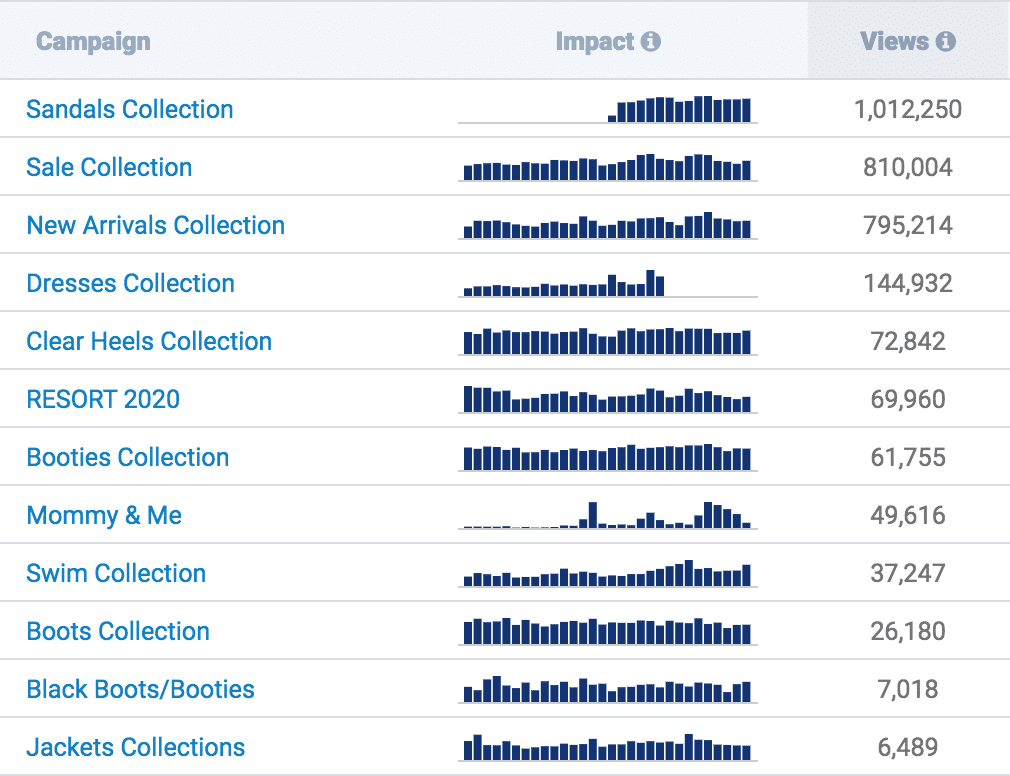
We are beginning to roll out some new insights within the Visual Merchandising list page! These new columns show you how often your campaign impacted your shoppers’ experience within the past 30 days, both in a trend graph and in total views.
This is rolling out to stores who have our newest tracking installed. If you don’t see this yet, keep an eye out in the coming months as we migrate everyone over.